Grafana Dashboards
Defakto components can be used with Grafana to visualize operational health of trust domains and clusters using pre-built dashboards. This page describes how to use Grafana with official Defakto operational dashboard templates.
Preconditions
Component Versions
- Trust Domain Server image version: At least v0.19.1
- Trust Domain Server Helm chart version: At least v0.15.0
- Agent image version: At least v0.16.0
- Agent Helm chart version: At least v0.9.0, and at least v0.22.2 if using reflector dashboard.
Enabled telemetry in Trust Domain Server and Agent
Telemetry must be enabled in the Trust Domain Server and Agent, depending on the dashboard you want to import. Instructions for enabling telemetry can be found in the Metrics Reference section.
Latency panels require the emitLatencyMetrics configuration to be enabled in the given component. See the Agent installation guide or the Server installation guide for instructions on enabling this setting.
Prometheus scraper configuration
Defakto Grafana dashboard templates rely on a Prometheus scraper configuration that properly collects metrics from Kubernetes pods. Your Prometheus configuration must include a job for scraping Kubernetes pods, typically structured like this:
- job_name: kubernetes-pods
  honor_labels: true
  honor_timestamps: true
  scrape_interval: 1m
  scrape_timeout: 10s
  metrics_path: /metrics
  scheme: http
  kubernetes_sd_configs:
  - role: pod
  relabel_configs:
  # Additional relabeling rules here
Within the relabeling rules, the most critical requirement is including a rule that extracts the pod name into a pod label:
- source_labels: [__meta_kubernetes_pod_name]
  separator: ;
  target_label: pod
  replacement: $1
  action: replace
This specific relabeling rule is essential because Defakto dashboard templates contain panels that filter metrics by discovered pods using the pod label. Without this relabeling rule, the panels in the dashboards will not function correctly.
The exact configuration may vary depending on your environment, but both the Kubernetes pods job and the pod name relabeling rule shown above (or equivalent settings) must be included.
Envoy Metrics for Service Mesh Dashboard
The Service Mesh dashboard relies on Envoy SDS metrics. When using Istio, you must configure your Istio installation to expose Envoy proxy metrics related to SDS. This can be done by applying an IstioOperator configuration like the following:
apiVersion: install.istio.io/v1alpha1
kind: IstioOperator
metadata:
  namespace: istio-system
spec:
  profile: default
  meshConfig:
    defaultConfig:
      proxyStatsMatcher:
        inclusionRegexps:
          - ".*sds.*"
This configuration ensures that Envoy proxies in your Istio service mesh will expose metrics related to SDS, which are required for the Service Mesh dashboard to function properly.
The Service Mesh dashboard only shows metrics from proxies using Defakto components. To enable filtering, add spirl_enabled: "true" as a pod label in the spirl sidecar injection template. Prometheus will automatically convert the pod label to a metric tag when scraping. This can be done by setting metadata.labels in the Istio Operator Injection Webhook Template, for example:
sidecarInjectorWebhook:
  templates:
    spirl: |
      metadata:
        labels:
          spirl-enabled: "true"
Importing Dashboard Templates
To import our dashboard templates into Grafana, copy the JSON file from the Defakto dashboards GitHub repository and import them into your Grafana instance. The following dashboard templates are available:
- Trust Domain Server Dashboard: spirl-trust-domain-server.json
- Defakto Agent Dashboard: spirl-agent.json
- SPIRL Reflector Dashboard: spirl-reflector.json
- Service Mesh Dashboard: service-mesh.json
To import a dashboard:
- Download the JSON payload for the dashboard you want to import
- In Grafana, navigate to Dashboards > New -> Import
- Paste the JSON content in the import input field
- Click on "Load"
- Select your Prometheus data source that contains the Defakto metrics
- Click on "Import" to finish the import process
Dashboard Details
This section includes a description of each panel and its calculation.
Defakto Agent Dashboard
Overview
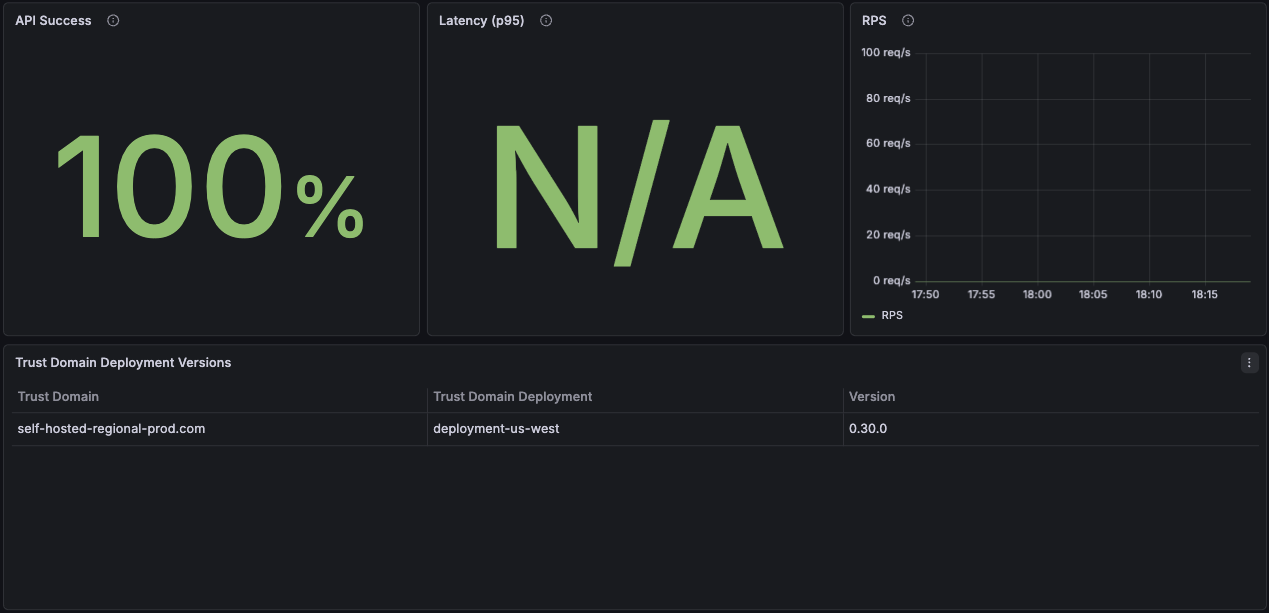
API Success
The agent provides APIs to workloads, primarily the SPIFFE Workload API and the Envoy Secret Discovery Service (SDS).
API Success monitors the result codes of API responses to workloads and reports the overall success rate. This metric calculates the percentage of successful requests by comparing non-error responses to total requests:
(REQUESTS WITH RESULT CODE = OK OR CANCELED) / TOTAL REQUESTS
A high success rate (>99%) indicates healthy agent operations. Lower rates may indicate attestation failures, network issues, or server connectivity problems.
Latency (p95)
Displays the 95th percentile response time for API requests from workloads to the agent. This metric indicates how 95% of requests take less than the indicated time to complete.
The agent cannot serve workload requests independently. Each request requires workload attestation and a transaction with the Trust Domain Server. Response times include network latency to the server and attestation processing time.
RPS (Requests Per Second)
Displays the rate of incoming requests from workloads to the agent, measured in requests per second. This metric helps identify workload activity patterns and peak usage times.
High RPS values may indicate increased workload activity, while sudden drops could signal application issues or pod terminations.
Trust Domain Deployment Versions
Displays the agent versions in your infrastructure along with the trust domain and trust domain deployments they are connected to. This panel helps track version consistency across deployments and identify outdated agent installations that may require upgrades.
Resource Utilization
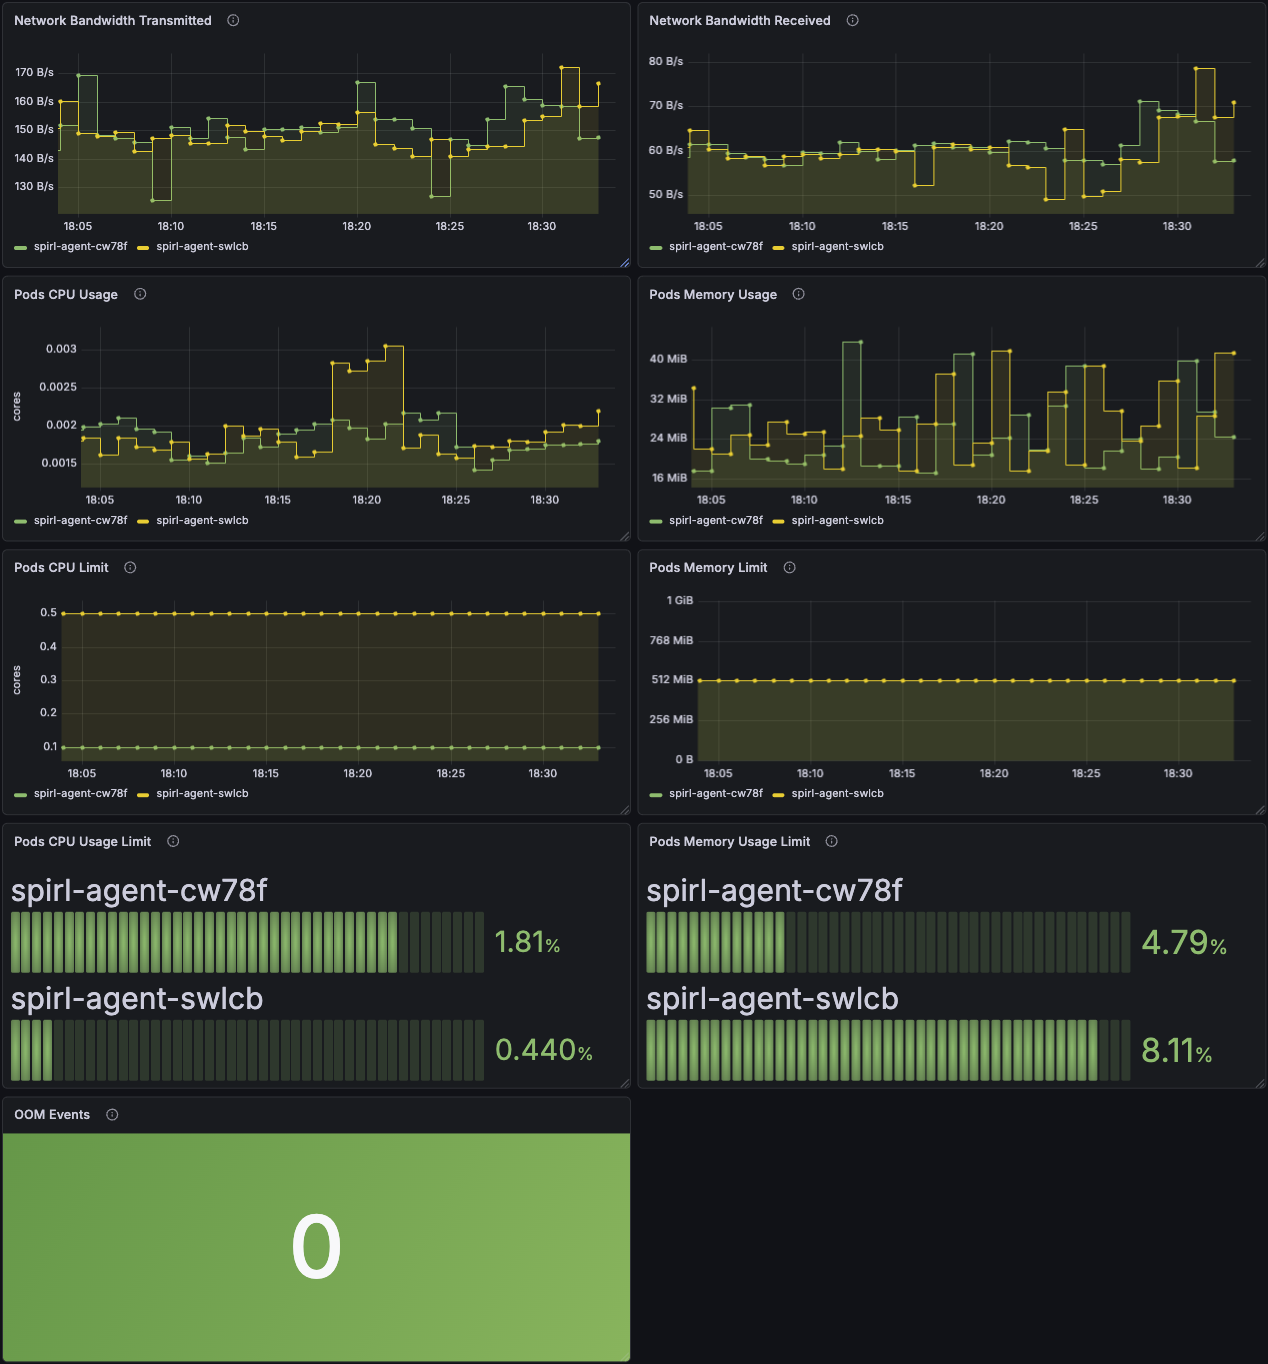
Network Bandwidth Transmitted
Displays the total bytes transmitted over the network by each agent pod. This metric uses cAdvisor's container_network_transmit_bytes_total to track outbound network traffic.
Increasing transmission rates typically correlate with higher workload activity or increased communication with Trust Domain Servers.
Network Bandwidth Received
Displays the total bytes received over the network by each agent pod. This metric uses cAdvisor's container_network_receive_bytes_total to track inbound network traffic.
Inbound traffic includes responses from Trust Domain Servers and may increase during certificate renewal periods or high workload activity.
Pods CPU Usage
Displays CPU consumption for each agent pod measured in CPU cores. This metric uses cAdvisor's container_cpu_usage_seconds_total.
Agent CPU usage typically remains stable. Spikes may indicate high attestation activity or increased workload request rates.
Pods Memory Usage
Displays current memory consumption for each agent pod. This metric uses cAdvisor's container_memory_working_set_bytes, which represents the actual memory in use.
Agent memory usage should remain relatively stable.
Pods CPU Limit
Displays the configured CPU resource limits for each agent pod from Kubernetes pod specifications. These limits represent the maximum CPU cores that each pod is allowed to consume.
Use this to check for any misconfigured pods.
Pods Memory Limit
Displays the configured memory resource limits for each agent pod from Kubernetes pod specifications. These limits represent the maximum memory that each pod is allowed to consume before being subject to termination.
Use this to check for any misconfigured pods.
Pods CPU Usage Limit
Displays the percentage of CPU usage relative to the configured CPU limit for each pod. Calculated as:
(CPU Usage Seconds Total / CPU Resource Limit) × 100
Values approaching 100% indicate pods are reaching their CPU limits and may experience throttling, which can impact request latency.
Pods Memory Usage Limit
Displays the percentage of memory usage relative to the configured memory limit for each pod. Calculated as:
(Memory Working Set Bytes / Memory Resource Limit) × 100
Values consistently above 90% indicate pods are at risk of out-of-memory termination. Consider increasing memory limits if pods regularly operate near this threshold.
OOM Events
Displays the total count of out-of-memory (OOM) events for agent pods using cAdvisor's container_oom_events_total metric.
OOM events indicate that a pod was terminated by the host for exceeding its memory limit. Any non-zero value requires investigation and likely indicates that memory limits need to be increased.
Service Performance
The protocols between agents and workloads use a combination of unary (request-response) and streaming (long-lived connection) requests:
Unary Requests: Individual transactions where a single request receives a single response. For example, FetchJWTSVID requests a JWT-based workload identity and receives an immediate response.
Streaming Requests: Long-lived connections that continuously push updates to the workload. For example, FetchJWTBundles establishes a stream that notifies the workload whenever trust bundles change.
The metrics below report response times only for unary requests, as streaming connections remain open indefinitely to deliver real-time updates.
In the SPIFFE Workload API Specification, FetchJWTSVID is defined as a unary RPC request, while FetchX509SVID is a streaming request.
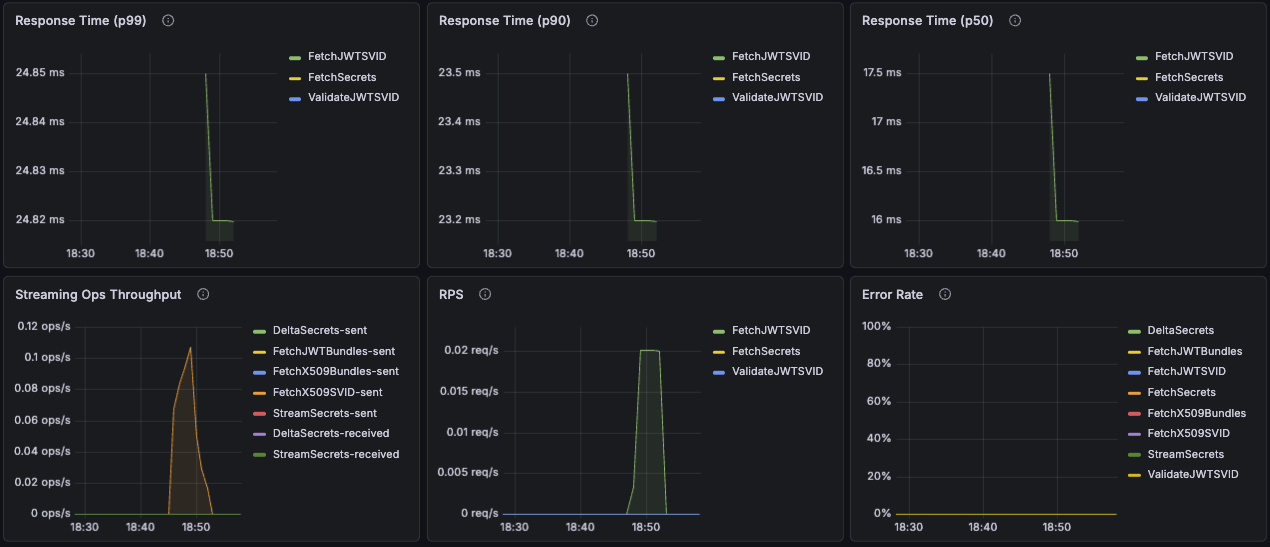
Response Time (p99)
Displays the 99th percentile response time for unary operations from workloads to the agent. This indicates how long it takes for 99% of requests to complete, helping identify worst-case performance without considering outliers.
Response Time (p90)
Displays the 90th percentile response time for unary operations from workloads to the agent.
Response Time (p50)
Displays the median (50th percentile) response time for unary operations from workloads to the agent.
Streaming Ops Throughput
Displays the rate of messages sent and received for streaming operations, measured over 5-minute intervals from the workload's perspective.
High throughput indicates active certificate renewals or frequent trust bundle updates. Low or zero throughput may indicate streaming connection issues.
RPS
Displays the rate of unary requests per second, measured over 5-minute intervals. This metric specifically tracks request-response operations and excludes streaming connections.
Error Rate
Displays the percentage of failed requests over time, calculated as:
(Failed Requests / Total Requests) × 100
This includes both unary and streaming request failures. Error rates above 1% warrant investigation.
Trust Domain Server Dashboard
Overview
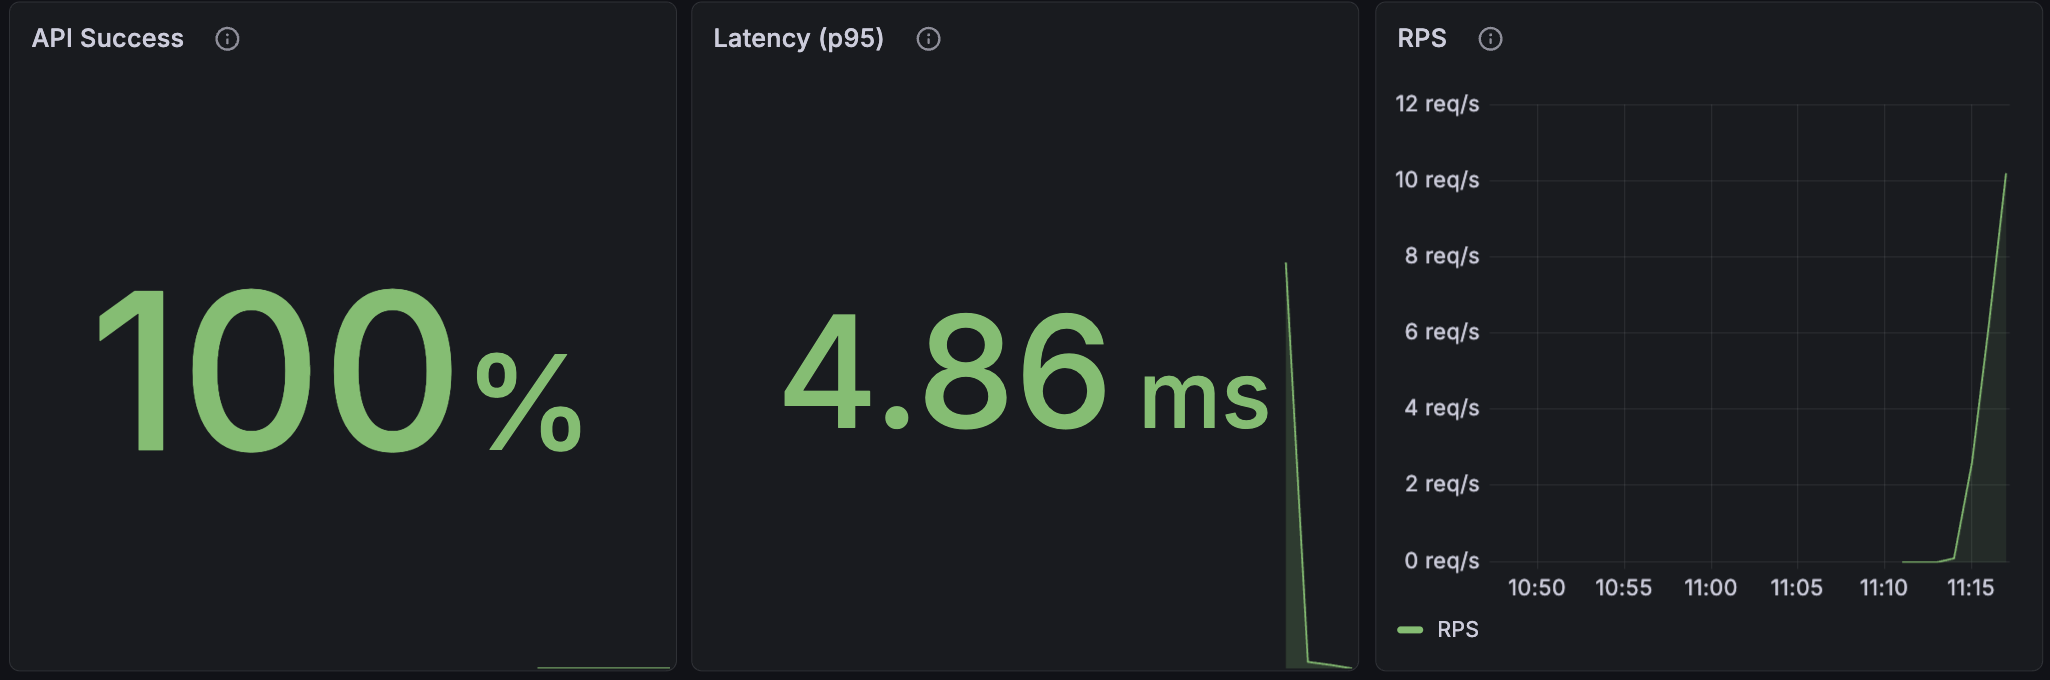
API Success
The server provides APIs to agents to authenticate the agents and mint credentials for workloads.
API Success monitors the result codes of API responses to agents and reports the overall success rate. This metric calculates the percentage of successful requests by comparing non-error responses to total requests:
(REQUESTS WITH RESULT CODE = OK OR CANCELED) / TOTAL REQUESTS
A high success rate (>99%) indicates healthy server operations. Lower rates may indicate attestation failures, network issues, or configuration issues.
Latency (p95)
Displays the 95th percentile response time for API requests from the agent. This metric indicates how 95% of requests take less than the indicated time to complete.
RPS (Requests Per Second)
Displays the rate of incoming requests from workloads to the agent, measured in requests per second. This metric helps identify workload activity patterns and peak usage times.
High RPS values may indicate increased workload activity, while sudden drops could signal application issues or pod terminations.
Trust Domain Deployment Versions
Displays the server versions in your infrastructure along with the trust domain and trust domain deployments they serve. This panel helps track version consistency across deployments and identify outdated server installations that may require upgrades.
Resource Utilization
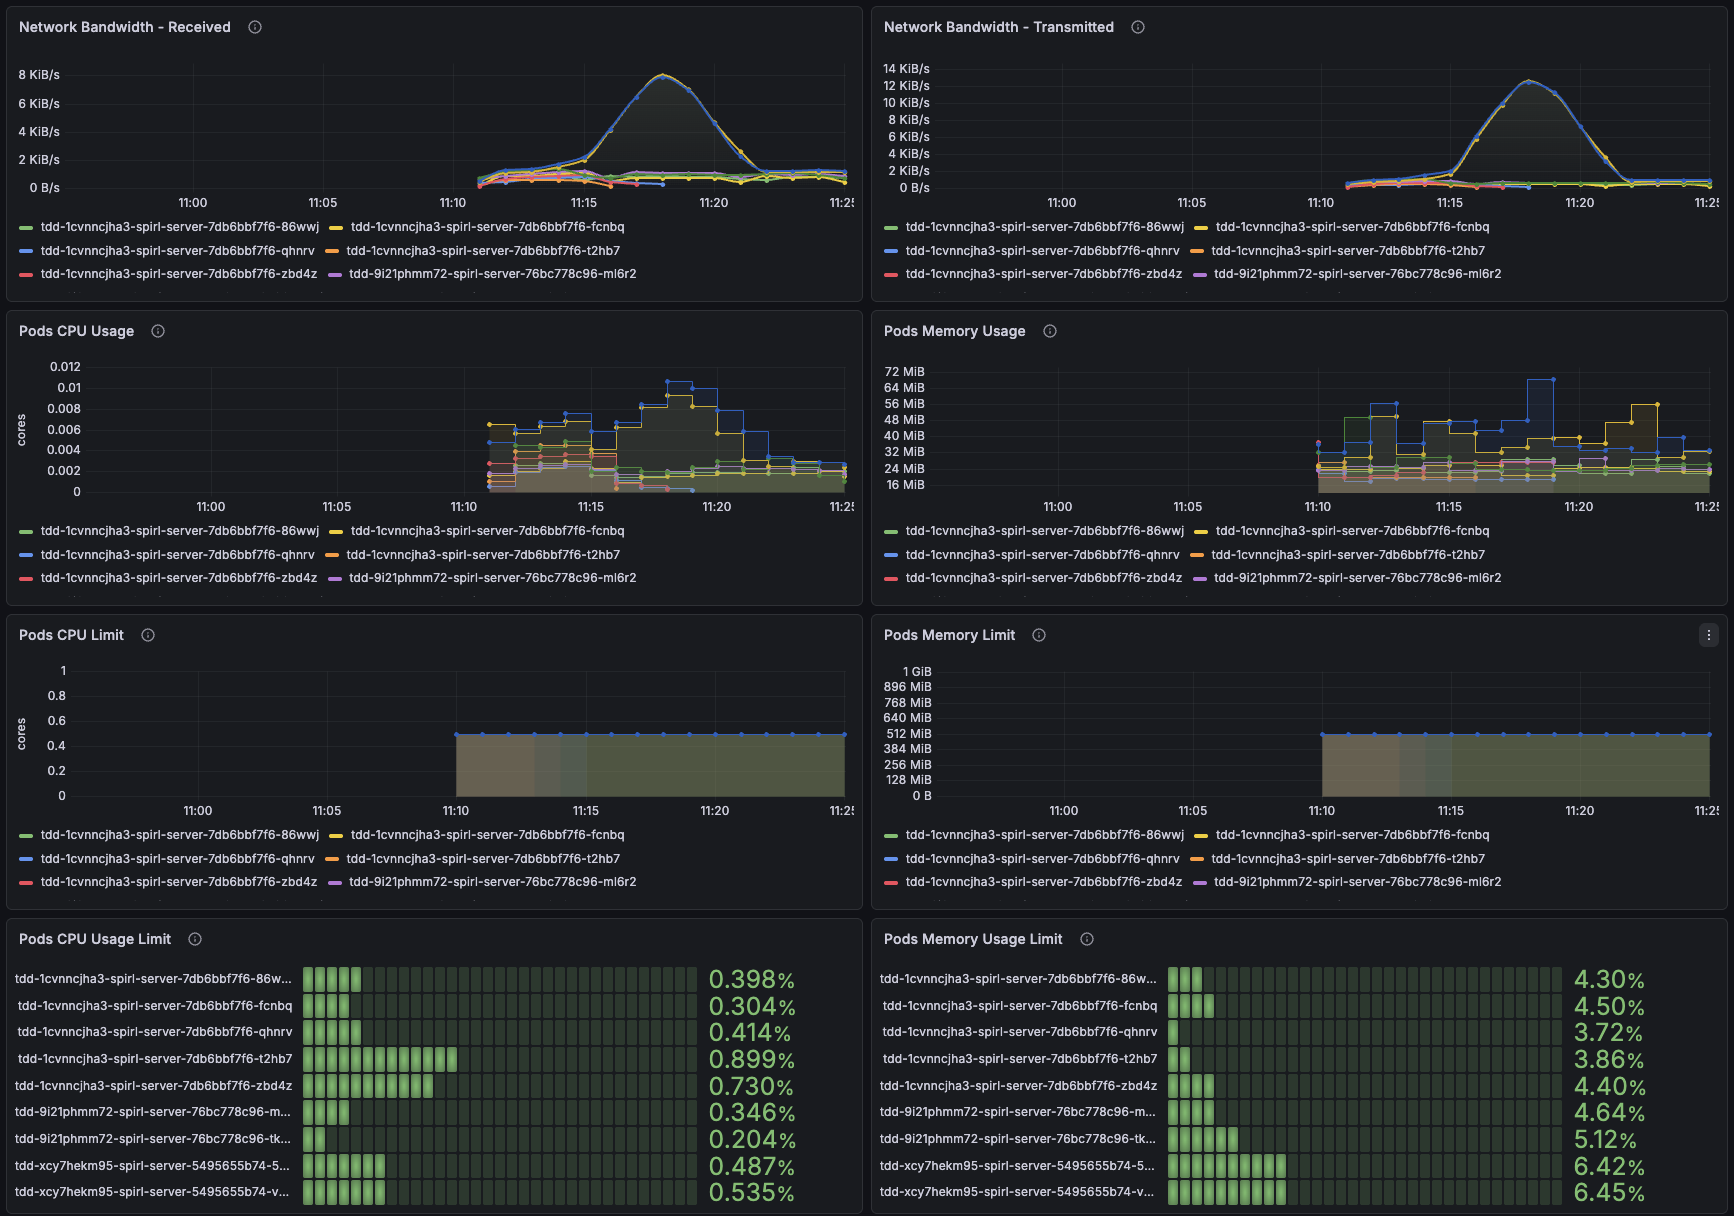
Network Bandwidth Transmitted
Displays the total bytes transmitted over the network by each server pod. This metric uses cAdvisor's container_network_transmit_bytes_total to track outbound network traffic.
Increasing transmission rates typically correlate with higher agent activity or increased communication with agents and the control plane.
Network Bandwidth Received
Displays the total bytes received over the network by each server pod. This metric uses cAdvisor's container_network_receive_bytes_total to track inbound network traffic.
Inbound traffic includes requests from agents and may increase during certificate renewal periods or high workload activity.
Pods CPU Usage
Displays CPU consumption for each server pod measured in CPU cores. This metric uses cAdvisor's container_cpu_usage_seconds_total.
Server CPU usage typically remains stable. Spikes may indicate high attestation activity or increased agent request rates.
Pods Memory Usage
Displays current memory consumption for each server pod. This metric uses cAdvisor's container_memory_working_set_bytes, which represents the actual memory in use.
Server memory usage should remain relatively stable based on the number of agents connected to a server and the request rate of new credentials.
Pods CPU Limit
Displays the configured CPU resource limits for each server pod from Kubernetes pod specifications. These limits represent the maximum CPU cores that each pod is allowed to consume.
Use this to check for any inconsistently or misconfigured pods.
Pods Memory Limit
Displays the configured memory resource limits for each server pod from Kubernetes pod specifications. These limits represent the maximum memory that each pod is allowed to consume before being subject to termination.
Use this to check for any inconsistently or misconfigured pods.
Pods CPU Usage Limit
Displays the percentage of CPU usage relative to the configured CPU limit for each pod. Calculated as:
(CPU Usage Seconds Total / CPU Resource Limit) × 100
Values approaching 100% indicate pods are reaching their CPU limits and may experience throttling, which can impact request latency.
Pods Memory Usage Limit
Displays the percentage of memory usage relative to the configured memory limit for each pod. Calculated as:
(Memory Working Set Bytes / Memory Resource Limit) × 100
Values consistently above 90% indicate pods are at risk of out-of-memory termination. Consider increasing memory limits if pods regularly operate near this threshold.
OOM Events
Displays the total count of out-of-memory (OOM) events for server pods using cAdvisor's container_oom_events_total metric.
OOM events indicate that a pod was terminated by the host for exceeding its memory limit. Any non-zero value requires investigation and likely indicates that memory limits need to be increased.
Service Performance
The Service Performance metrics are captured from the Trust Domain Server's perspective and calculated from when a request is received until the response is sent.
The protocols between agents and servers use a combination of unary (request-response) and streaming (long-lived connection) requests:
Unary Requests: Individual transactions where a single request receives a single response. For example, FetchJWTSVID requests a JWT-based workload identity and receives an immediate response.
Streaming Requests: Long-lived connections that continuously push updates to the workload. For example, FetchJWTBundles establishes a stream that notifies the workload whenever trust bundles change.
The metrics below report response times only for unary requests, as streaming connections remain open indefinitely to deliver real-time updates.
In the SPIFFE Workload API Specification, FetchJWTSVID is defined as a unary RPC request, while FetchX509SVID is a streaming request.
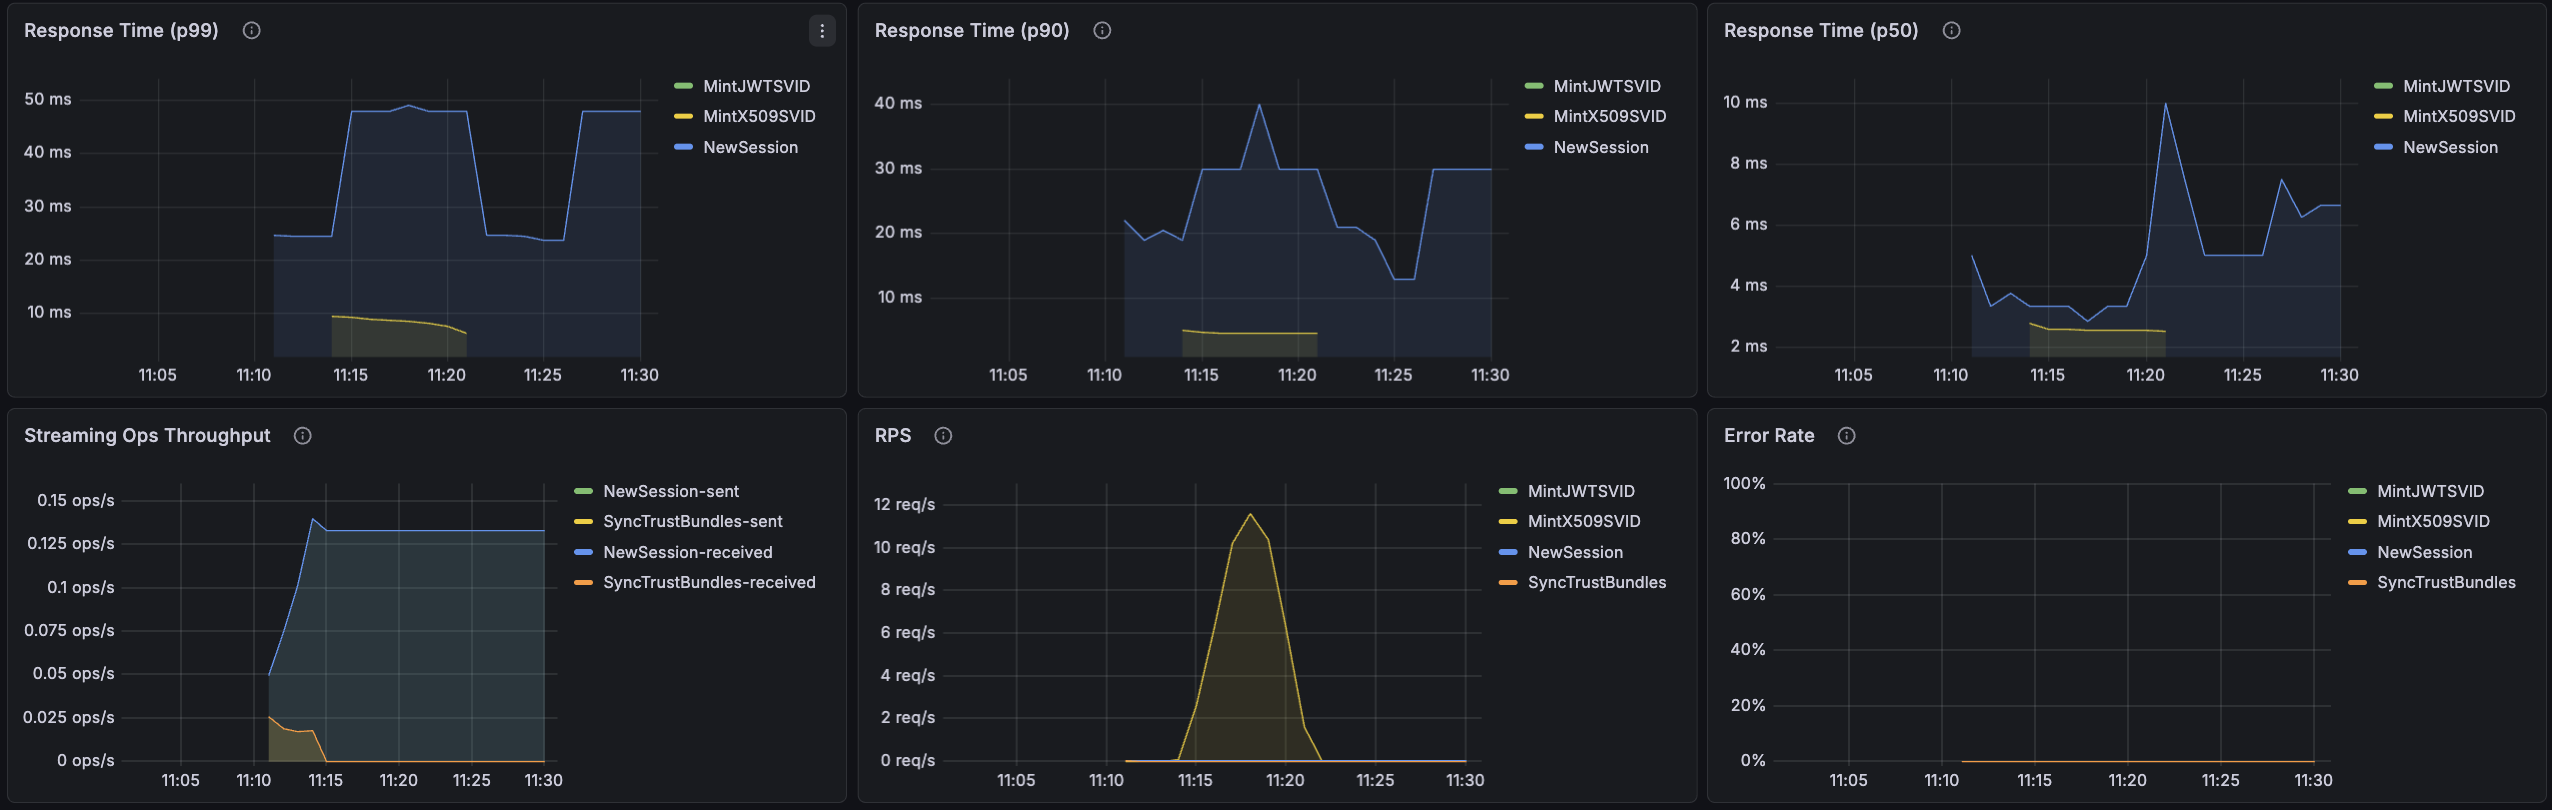
Response Time (p99)
Displays the 99th percentile response time for unary operations from agents to the server. This indicates how long it takes for 99% of requests to complete, helping identify worst-case performance.
Response Time (p90)
Displays the 90th percentile response time for unary operations from agents to the server. This represents typical response times under normal conditions.
Response Time (p50)
Displays the median (50th percentile) response time for unary operations from agents to the server. This represents the average experience for most requests.
Streaming Ops Throughput
Displays the rate of messages sent and received for streaming operations, measured over 5-minute intervals from the agent's perspective.
High throughput indicates active certificate renewals or frequent trust bundle updates. Low or zero throughput may indicate streaming connection issues.
RPS
Displays the rate of unary requests per second, measured over 5-minute intervals. This metric specifically tracks request-response operations and excludes streaming connections.
Error Rate
Displays the percentage of failed requests over time, calculated as:
(Failed Requests / Total Requests) × 100
This includes both unary and streaming request failures. Error rates above 1% warrant investigation into server logs, agent connectivity, or attestation issues.
Control Plane Connectivity
Servers connect to the Defakto Control Plane, which provides a number of services for operation:
- Configuration: Configuration changes by users are sent to the Defakto Control Plane and then distributed to each group of servers. This includes federation configuration.
- Events: Servers send events to the control plane for use in the Defakto Console.
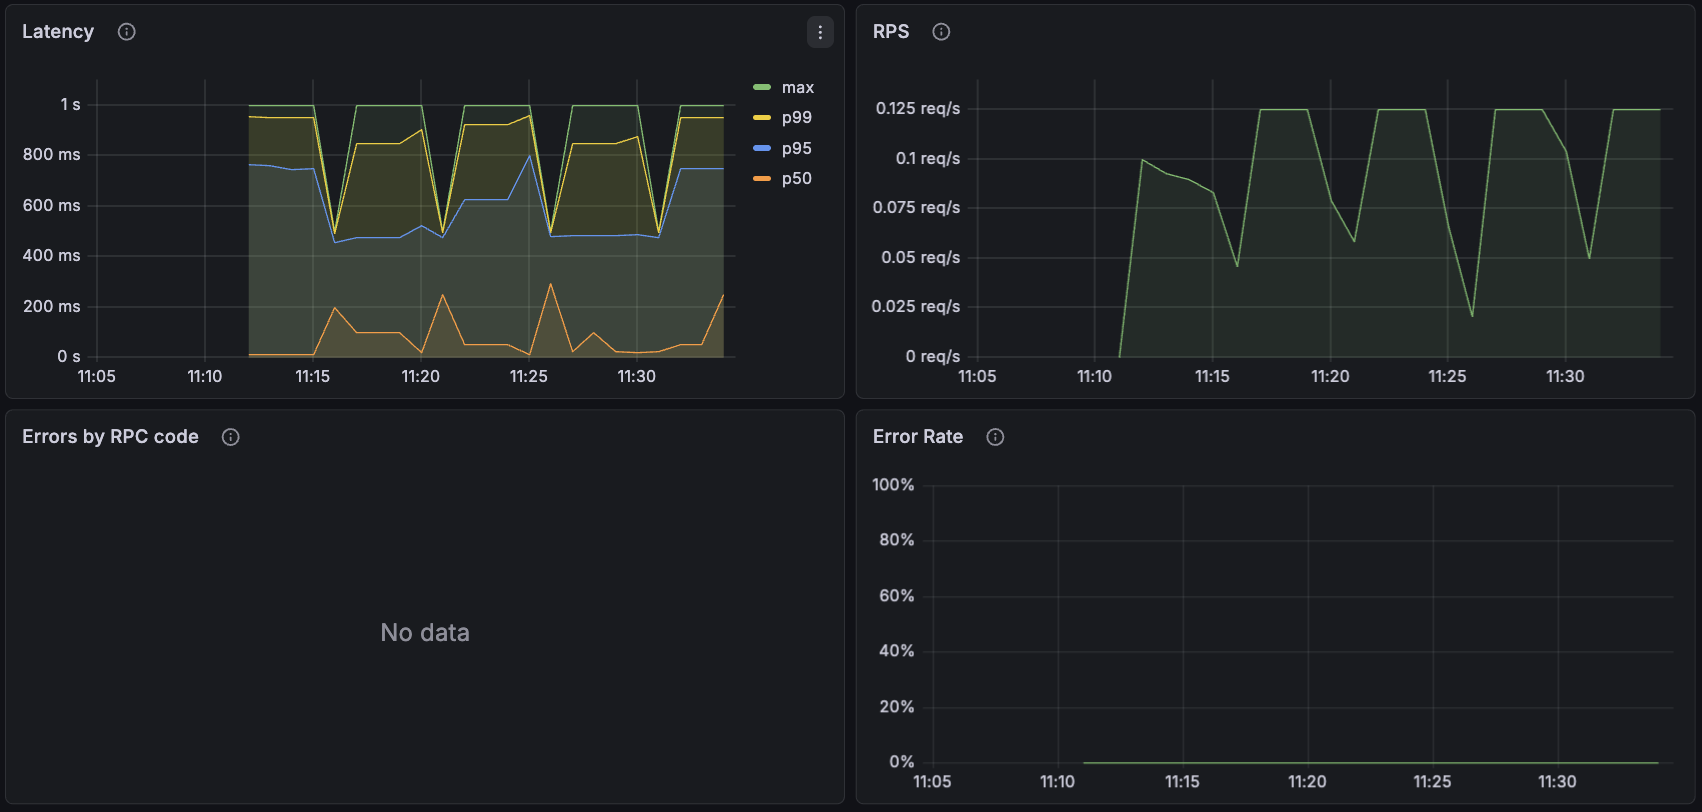
Latency
Represents the latency of processing RPCs from the control plane for various requests.
RPS
Represents the RPCs per second that are being handled by a server. Most configuration operations sent by the control plane will only use a single server assigned randomly (no elections involved). The server that receives the request stores the configuration change in the Kubernetes cluster, and other servers that are part of the same deployment read the configuration changes from Kubernetes.
Errors by RPC Code
Errors observed in the protocol, broken down by RPC code.
Error Rate
The error rate observed on the server-to-control-plane connection.